
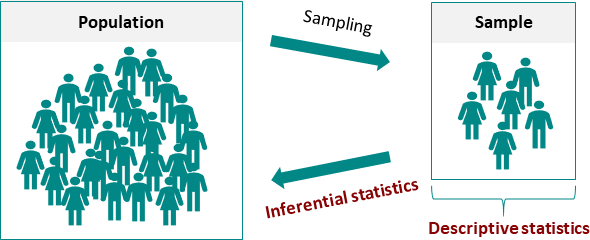
Descriptive and inferential statistics are two branches of statistics used to analyze and interpret data. While descriptive statistics is concerned with summarizing and presenting data, inferential statistics involves making predictions and drawing conclusions based on the data.
Descriptive statistics
Descriptive statistics is a branch of statistics that deals with the collection, analysis, and presentation of data. It involves summarizing, organizing, and describing data in order to draw useful information and insights from it. Descriptive statistics are used to describe the basic features of data such as mean, median, mode, standard deviation, and range. These measures provide a simple overview of the data, and they help in identifying patterns and trends that may be useful for further analysis.
Descriptive statistics is often the first step in analyzing data. It involves summarizing and presenting data in a way that is easy to understand. Descriptive statistics can be used to describe the central tendency, variability, and distribution of a data set. Some common measures used in descriptive statistics are mean, median, mode, range, variance, and standard deviation. Descriptive statistics can be used to provide a visual representation of the data through the use of graphs and charts.
Descriptive statistics are useful in research because they help to identify patterns and trends in the data. For example, a researcher may use descriptive statistics to summarize the demographic characteristics of a study sample or to describe the frequency and duration of certain behaviors or events. Descriptive statistics can also be used to compare different groups or conditions in a study.
Inferential statistics
Inferential statistics, on the other hand, is a branch of statistics that deals with the inference or conclusion drawn from the sample data to the larger population. It involves making inferences, predictions, or generalizations about a larger group based on the data collected from a smaller group. Inferential statistics are used to test hypotheses, identify relationships between variables, and make predictions about future events.
Inferential statistics involves making predictions and drawing conclusions based on the data. Inferential statistics can be used to test hypotheses and determine the probability of certain outcomes. The goal of inferential statistics is to generalize from a sample to a larger population.
Inferential statistics typically involve hypothesis testing, which involves comparing the results of a study to what would be expected by chance. The results of hypothesis testing are expressed as a probability value, known as a p-value. If the p-value is less than a predetermined level of significance (usually 0.05), the results are considered statistically significant, meaning that the observed results are unlikely to have occurred by chance.
Inferential statistics are useful in research because they allow researchers to make generalizations about a larger population based on the results of a study. For example, a researcher may use inferential statistics to test the effectiveness of a new medication on a sample of patients, and then generalize the results to a larger population.
Inferential statistics requires that the data is collected randomly, or at least that the sample data is representative of the larger population. It also requires that the data is normally distributed, which means that the data follows a normal bell-shaped curve. If the data is not normally distributed, it may require transformation to meet the assumptions of inferential statistics.
In conclusion, both descriptive and inferential statistics are essential in research. Descriptive statistics can help to summarize and present data in a way that is easy to understand, while inferential statistics allow researchers to make predictions and draw conclusions based on the data. By using both descriptive and inferential statistics, researchers can gain a better understanding of their data and make more informed decisions.
Example
Suppose we have the age of 15 individuals.
| 69 | 59 | 38 | 10 | 17 | 14 | 28 | 57 | 54 | 36 | 17 | 54 | 77 | 43 | 14 |
|---|
Now,
we can find descriptive statistics such as mean, median, and standard deviation.
Mean = 39.1
Median = 38
Standard Deviation ($\sigma$) = 21.2
Similarly,
We can compute inferential statistics, such as t-tests, after descriptive statistics.
We are computing the t-test because the sample size is less than 30 and age is a ratio scale variable.
\[ t-stat = \frac{\bar{X}-\mu}{\frac{\sigma}{\sqrt{n}}}\]
Now,
We want to test if the average age is 25
Null Hypothesis (Ho): Average age ($\bar{X}$)=25
\[ t-stat = \frac{25-39.1}{\frac{21.2}{\sqrt{15}}}\]
\[t-stat=-2.59\]
Following rule of thumb, if $t-stat=|-2.59|>2$, we reject the null hypothesis of average age equals 25.
Thus, descriptive statistics is often the first step in statistical analysis. Once the data is described, inferential statistics can be applied to make inferences about the population from the sample data. This is done by using statistical tests such as t-tests, ANOVA, and regression analysis.
Key Differences
| Basis of difference | Descriptive statistics | Inferential statistics |
|---|---|---|
| Goal | To describe and summarize the features of a dataset. | To make predictions and draw conclusions about a larger population based on a smaller sample. |
| Population vs. sample | Concerned with analyzing a sample of data. | Concerned with making inferences about a population based on a sample. |
| Data type | Can be used for both qualitative and quantitative data. | Typically used for quantitative data. |
| Measures used | Measures such as mean, median, mode, standard deviation, and range are commonly used. | Measures such as confidence intervals, hypothesis tests, and regression analysis are commonly used. |
| Assumptions | Generally, no assumptions are made about the underlying population. | Assumes that the sample is representative of the population and that the data is normally distributed. |
| Sample size | Can be used with any sample size. | Requires a sufficiently large sample size to ensure that the sample is representative of the population. |
| Purpose | Used to describe, summarize, and explore a dataset. | Used to make predictions, draw conclusions, and test hypotheses about a population. |
| Representation | Provides a summary of the data that can be easily understood. | Makes generalizations about a population based on a sample, and estimates the degree of uncertainty associated with those generalizations. |
| Application | Used in fields such as social sciences, business, and healthcare. | Used in fields such as economics, engineering, and science. |
| Examples | Mean, median, mode, standard deviation, and range. | Confidence intervals, hypothesis tests, regression analysis, and ANOVA. |
Post a Comment